Discussing the Nasdaq 20-Year Rise and Peak Controversy
The Nasdaq Composite Index has been a symbol of tech-driven growth for decades, but its remarkable 20-year rise from 2005 to 2025 has sparked intense debate: Is this a sustainable boom or an impending bubble peak? As of October 2, 2025, Nasdaq sits at record highs, fueled by AI, semiconductors, and big tech giants like Apple, Nvidia, and Microsoft. Yet, whispers of a "peak controversy" grow louder, with concerns over.
overvaluation, inflation, and geopolitical tensions echoing the dot-com bust of 2000. This blog post dives deep into the Nasdaq's 20-year trajectory, analyzing historical performance, key drivers, and the bubbling controversy. We'll use charts, timelines, and data from reliable sources like Macrotrends and FRED to provide a balanced view. Whether you're an investor, analyst, or curious reader, this guide examines if Nasdaq's peak is a top or just a pause in a long bull run.
 |
| 붕어빵 뉴스 |
From the 2008 financial crisis recovery to the 2020 COVID surge, Nasdaq has delivered over 1,000% returns in 20 years—outpacing the S&P 500. But with P/E ratios at 40+ and warnings of a 2025 crash (as per Wikipedia's hypothetical entry on tariff-induced volatility), is the party over? Let's unpack the rise, controversy, and what it means for 2025 investments.
Nasdaq Composite: A Brief History and Its Role in Global Markets
Launched in 1971 as the world's first electronic stock market, the Nasdaq Composite tracks over 3,000 stocks, heavily weighted toward technology (45%+ in 2025). Unlike the Dow Jones (price-weighted), Nasdaq is market-cap weighted, making it sensitive to giants like the "Magnificent Seven" (Apple, Amazon, etc.). Its history includes booms (1990s dot-com) and busts (2000 crash, down 78%), but resilience defines it—recovering to new highs repeatedly.
In 2025, Nasdaq's market cap exceeds $25 trillion, driven by AI hype and low interest rates. But controversies arise: Is this AI-fueled rise a repeat of the dot-com bubble? Analysts like those from Morningstar warn of overvaluation, citing lessons from 150 years of crashes.

Key Milestones in Nasdaq's History
Nasdaq's evolution reflects tech innovation cycles:
- 1971: Launch as electronic exchange.
- 2000: Dot-com peak at 5,048, then crash.
- 2008: Financial crisis drop to 1,265.
- 2015: Surpasses 2000 high.
- 2020: COVID surge, +44% yearly gain.
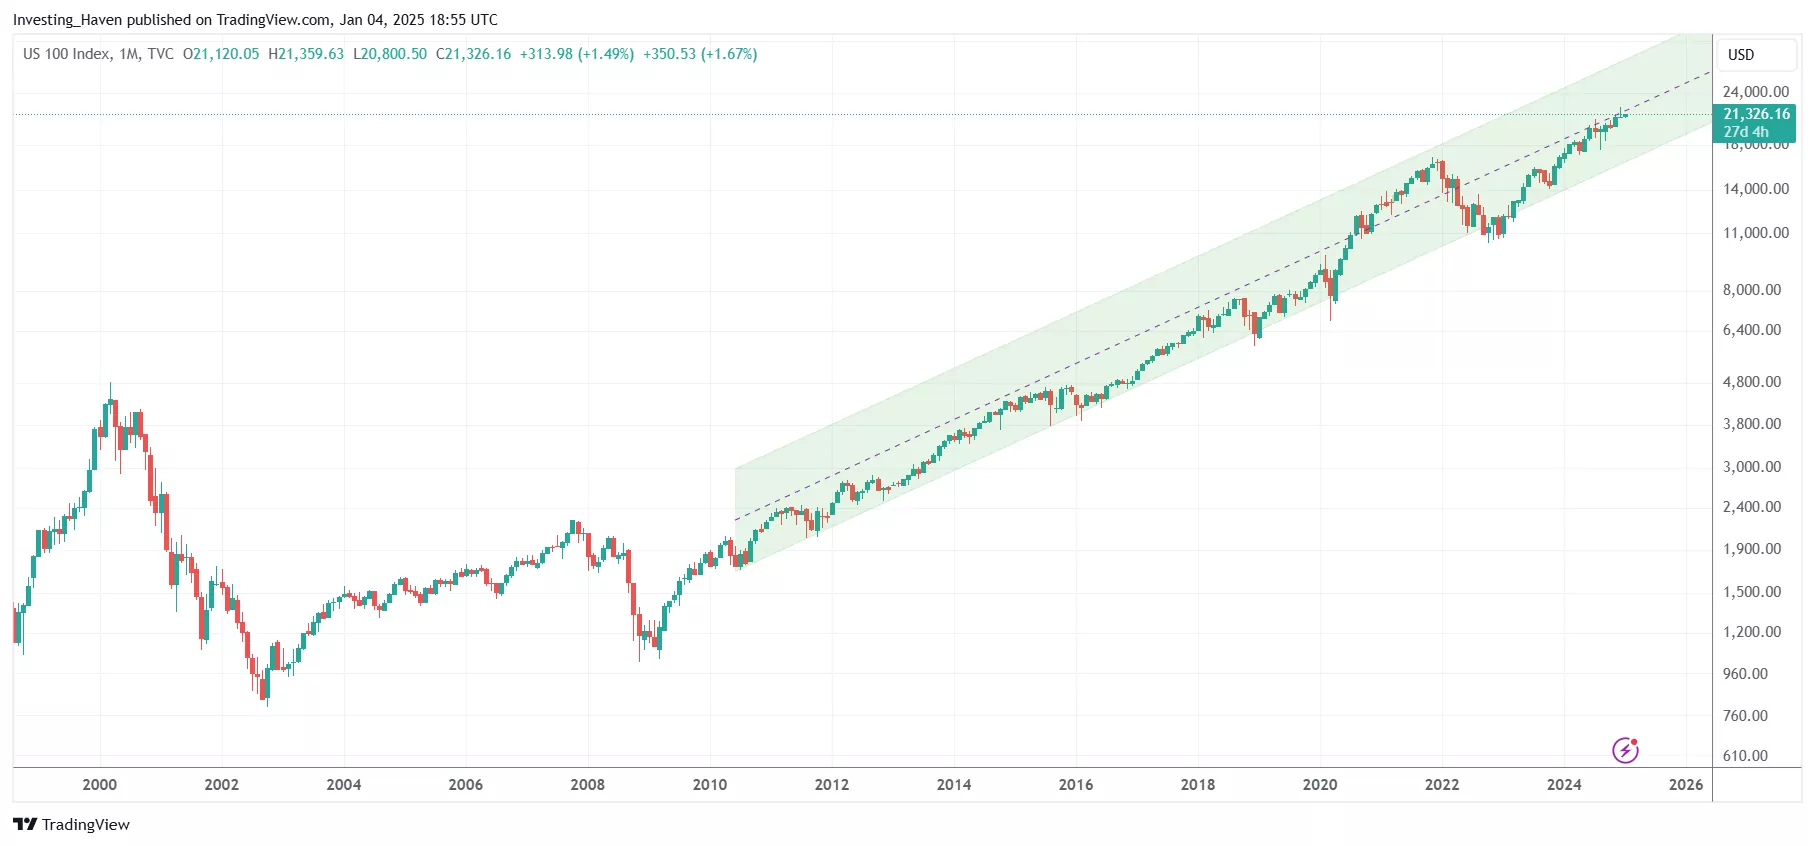
- 2025: AI boom pushes to 20,000+, but tariff policies spark crash fears (April 2, 2025, per Wikipedia).
The Nasdaq 20-Year Rise: From 2005 Recovery to 2025 AI Boo
From 2005 (post-dot-com recovery, index ~2,000) to 2025 (~20,000), Nasdaq has
risen over 900%, annualized return ~12%. Key drivers:
- Tech Dominance: FAANG stocks (now Magnificent Seven) account for 50%+ weight. Nvidia's AI chips alone drove 150% gains in 2024.
- Low Rates & Stimulus: Fed's zero rates (2010s-2020s) fueled growth; 2025 rate cuts (0.5% in September) extend rally.
- Innovation Cycles: Dot-com (internet), 2010s (cloud/mobile), 2020s (AI/metaverse). Data from Macrotrends shows inflation-adjusted growth, with volatility (e.g., 2022 -33% drop) but consistent rebounds. 2025 YTD +20%, but overpriced fears (P/E 35 vs historical 25) mount.
Performance Breakdown (2005–2025)
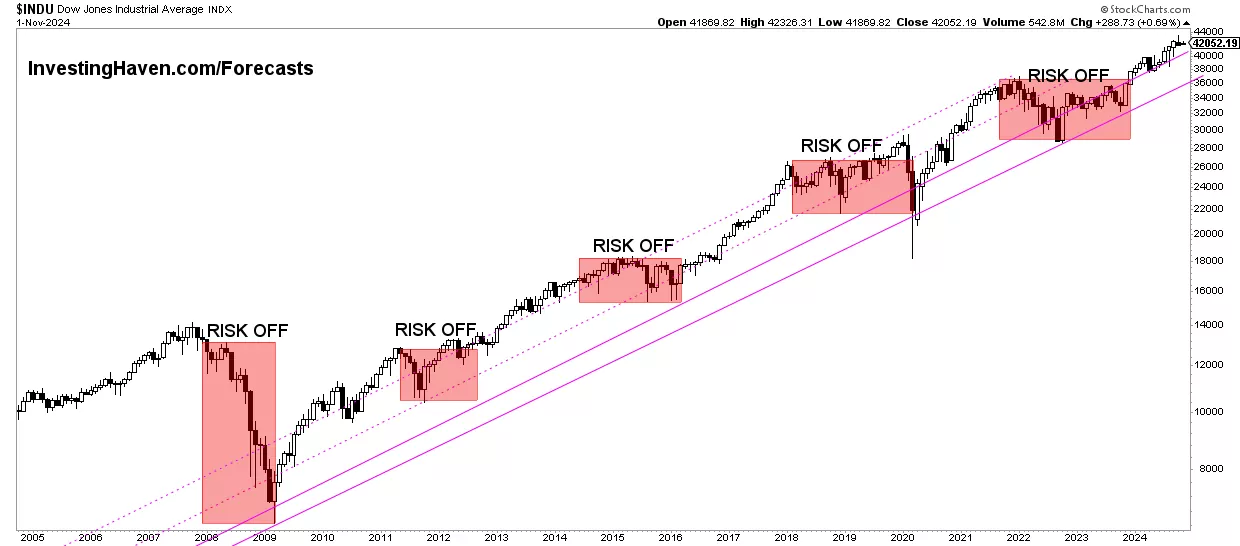
Nasdaq's rise isn't linear—major dips (2008 -50%, 2022 -33%) highlight risks. Yet, long-term holders saw massive gains:
- 2005–2015: +150% (tech recovery).
- 2015–2025: +300% (AI/ pandemic boom). FRED data shows 2025 high amid rate cuts, but Al Jazeera reports overpricing fears.
20-Year Nasdaq Timeline Summary
| Year | Key Event | Index Level | Annual Return | Controversy/Note |
|---|---|---|---|---|
| 2005 | Post-dot-com recovery | ~2,200 | +1.4% | Stable growth start |
| 2008 | Financial crisis | ~1,577 | -40.5% | Major crash, bailout era |
| 2015 | Tech surge | ~5,000 | +5.7% | Surpasses 2000 peak |
| 2020 | COVID boom | ~12,888 | +43.6% | Pandemic rally |
| 2022 | Inflation dip | ~10,466 | -33.1% | Bear market fears |
| 2025 | AI/tariff volatility | ~20,000 | +20% YTD | Peak controversy, crash warnings |
Data from Macrotrends and Yahoo Finance.
The Peak Controversy: Bubble or Sustainable Growth in 2025?
Nasdaq's 2025 highs have ignited controversy: Is it a bubble like 2000, or a
new normal? Arguments for bubble:
- Overvaluation: P/E ratio 35 (historical avg 25), per Reuters—echoing dot-com levels.
- Tariff Impacts: Wikipedia's 2025 crash entry cites April tariffs causing volatility.
- Risk-Off Signals: Al Jazeera notes record highs amid fears of crash, similar to 150-year patterns (Morningstar).
Counterarguments for growth:
- AI Fundamentals: Unlike dot-com hype, Nvidia's earnings justify valuations (2024 +150%).
- Rate Cuts: Yahoo Finance reports Fed's September cut boosting Nasdaq +2%.
- Historical Resilience: Macrotrends charts show recoveries post-crash.
2025 outlook: Potential correction (10-20%) if tariffs escalate, but long-term bullish on tech.
Bubble vs Growth Debate Table
| Factor | Bubble Argument | Growth Argument |
|---|---|---|
| Valuation | P/E 35, overpriced | Earnings growth justifies (AI boom) |
| External Risks | Tariffs, inflation | Rate cuts support |
| Historical Parallel | Dot-com 2000 repeat | Stronger fundamentals than past |


0 댓글